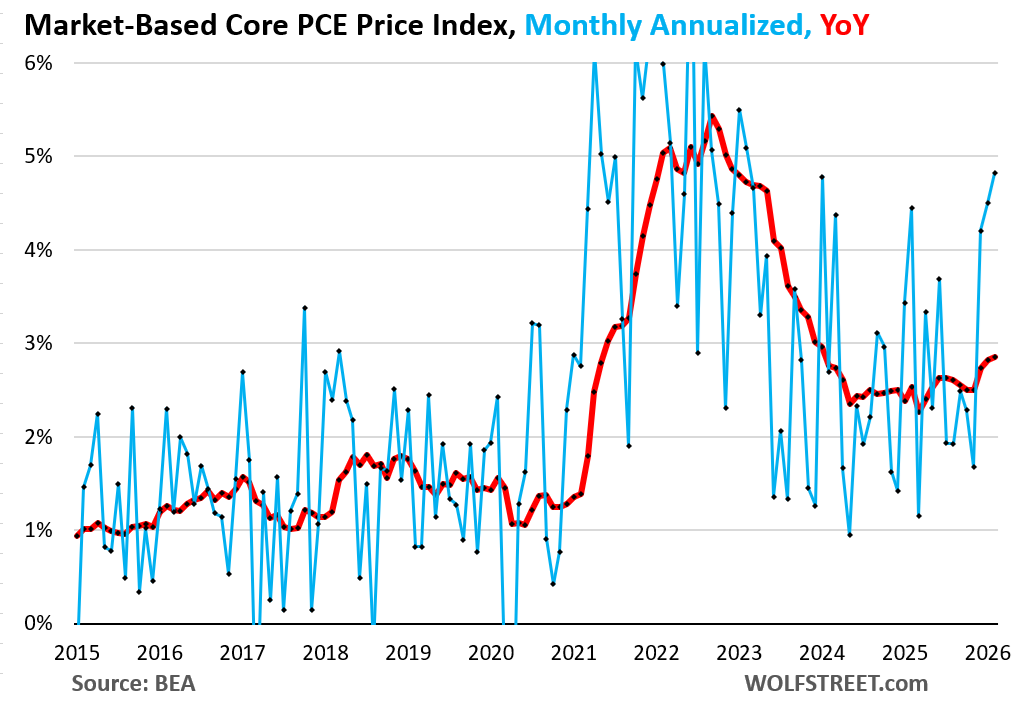
The market-based core PCE price index, which strips out all imputed housing costs, surged 0.39% in February from January. That’s a +4.8% annualized rate and the sharpest monthly jump since February 2023. Year-over-year, it hit 2.9%, the highest since January 2024. This measure cuts through the fog of estimated rents that official stats use to paint a rosier inflation picture. Before any Iran conflict energy shocks kicked in, underlying price pressures already accelerated.
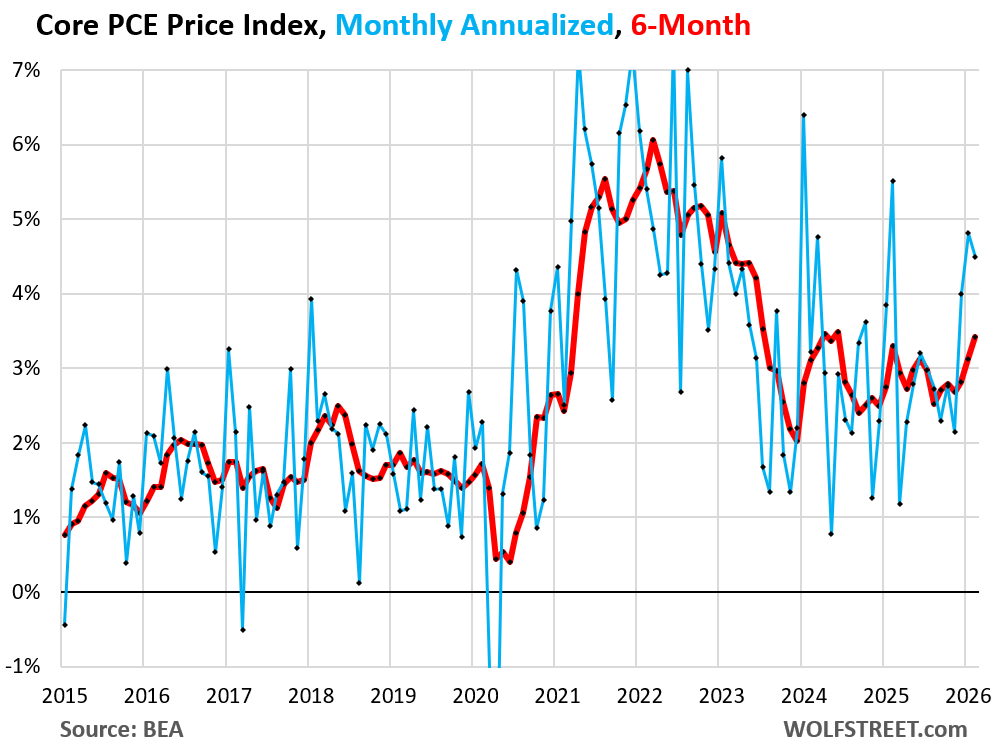
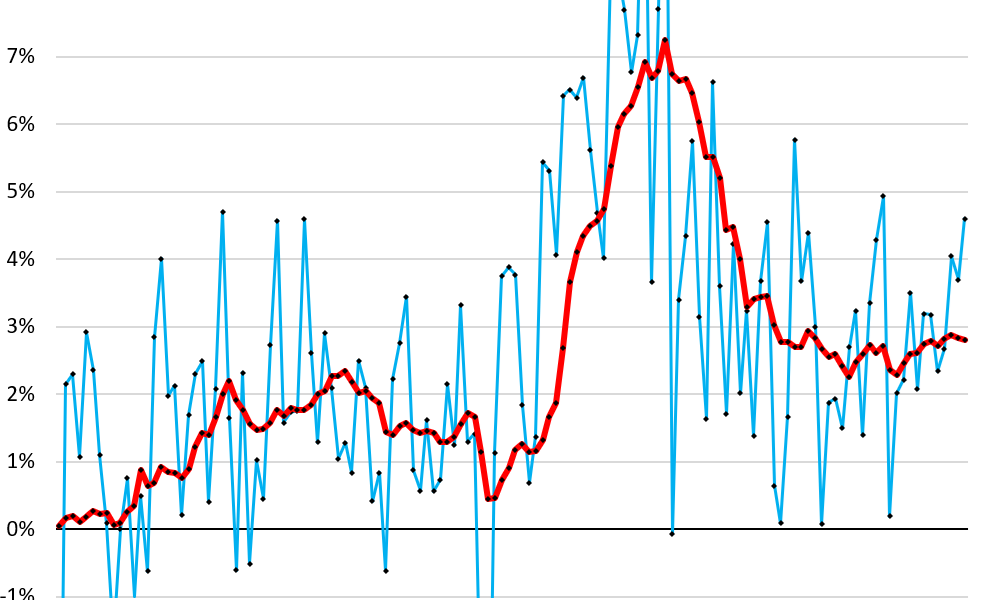
Overall PCE price index, the Fed’s preferred gauge that includes food and energy, rose 0.38% month-over-month, annualizing to +4.6%—the biggest leap in a year. Year-over-year, it climbed to 2.8%, matching the prior three months’ pace and the strongest since spring 2024. The Fed aims for 2%. Core PCE, excluding food and energy, gained 0.37% monthly (+4.5% annualized), marking the third straight month above 4% annualized. The six-month core PCE now stands at +3.4% annualized, the worst reading since June 2024. This trend line screams acceleration, not the cooldown markets bet on.
Housing’s Artificial Brake
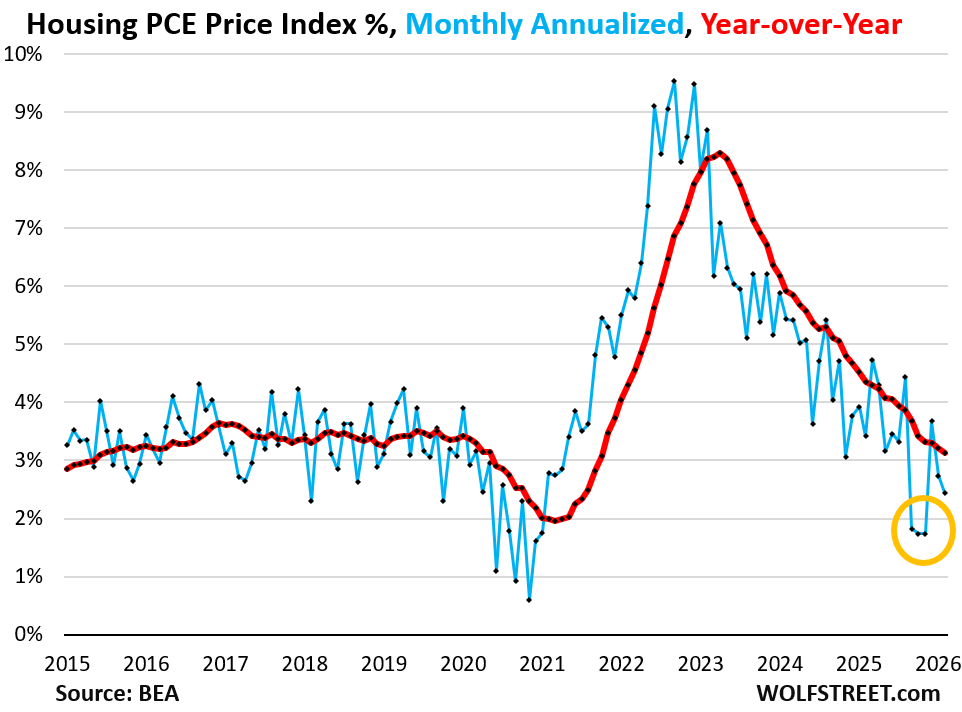
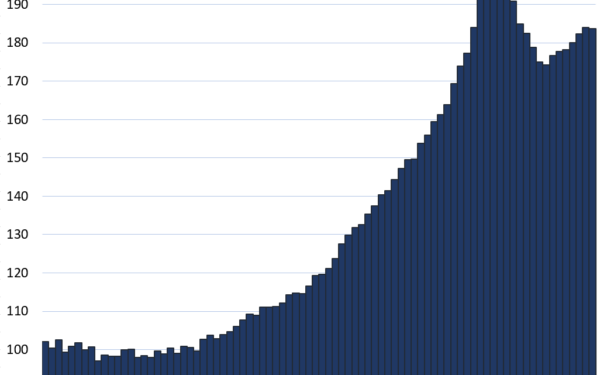
Housing components drag down the headline numbers. The housing PCE index rose just 0.20% in February (+2.45% annualized), and 3.1% year-over-year. Much of this relies on “imputed” rents—what the Bureau of Labor Statistics guesses homeowners would pay to rent their own homes. Real costs like surging homeowner insurance (up 20-30% in many states last year), property taxes, HOA fees, and maintenance hit consumers harder, but they don’t show up here.
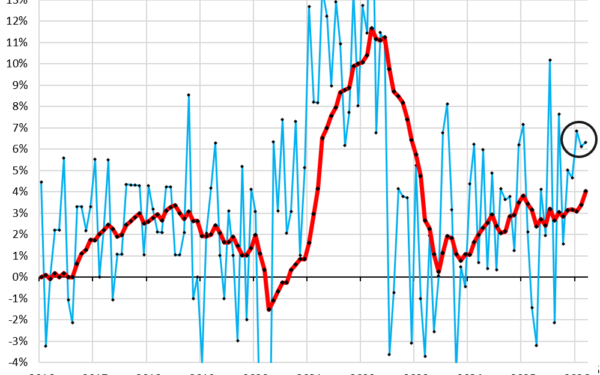
Skepticism is warranted: BLS tweaked its owner’s equivalent rent methodology last fall, creating outlier drops in three months (visible in charts as yellow-circled anomalies). Those will suppress year-over-year figures until September. Without this imputed fudge, inflation looks stickier. Why it matters: Housing distorts policy signals. The Fed watches PCE closely; ignoring this market-based spike risks underestimating persistent inflation.
Durable Goods Drive the Spike
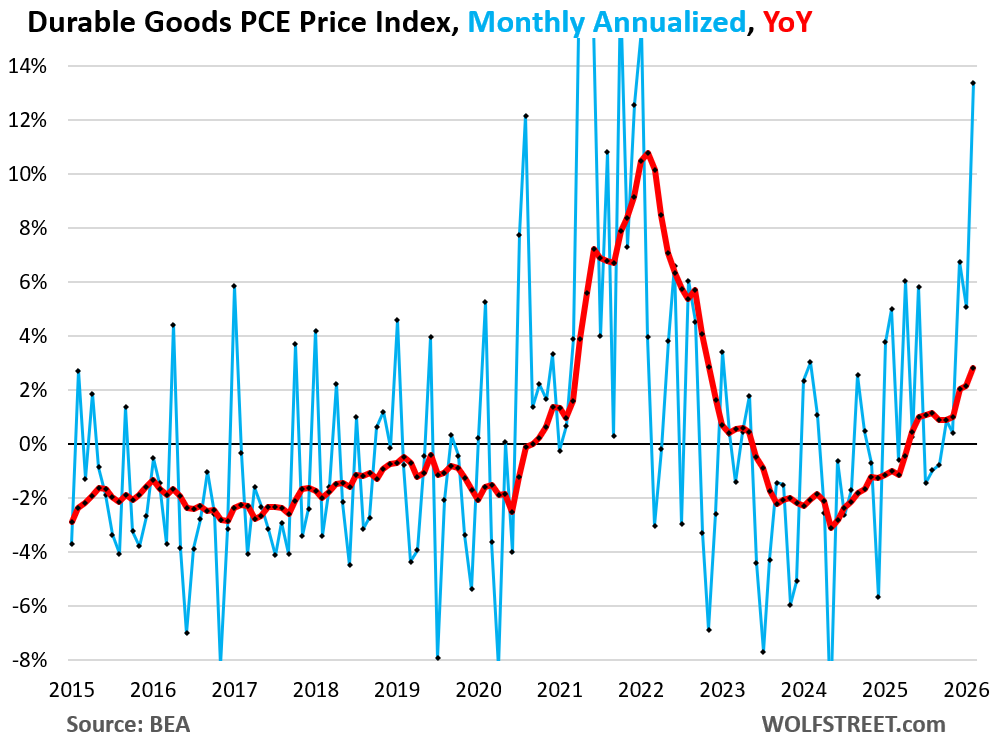
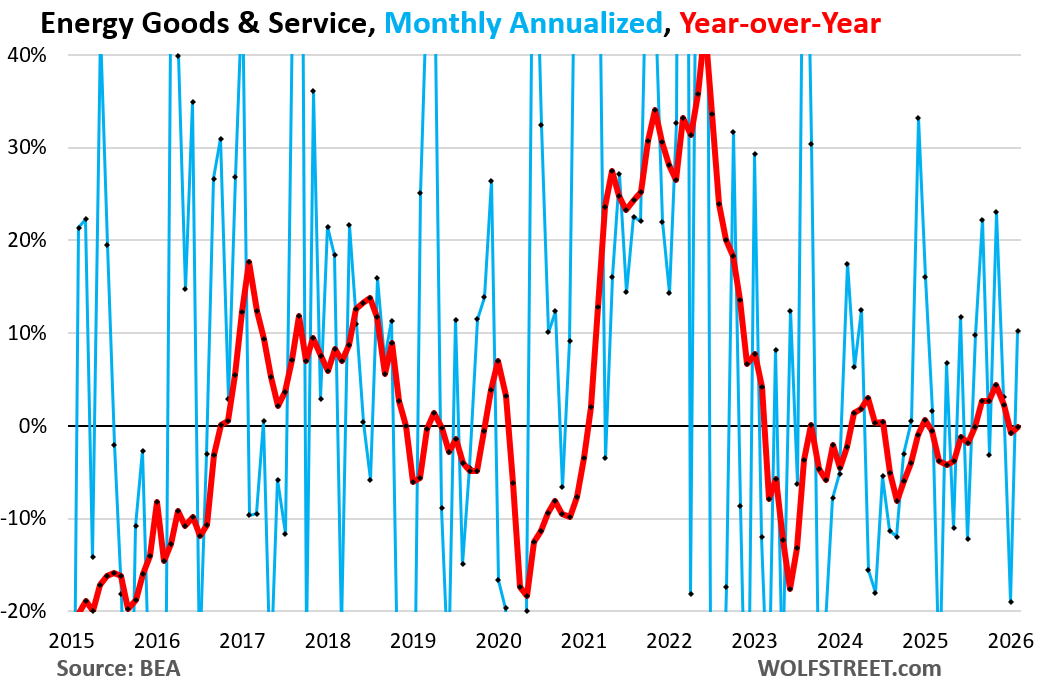
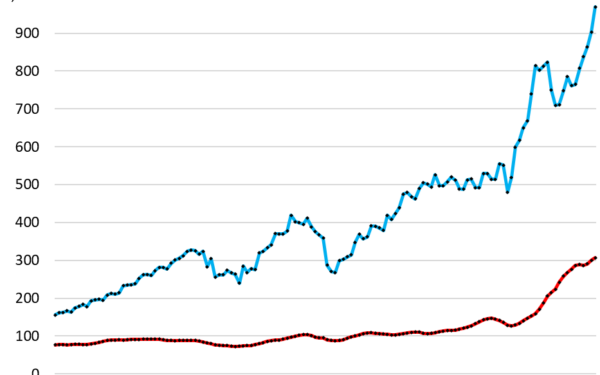
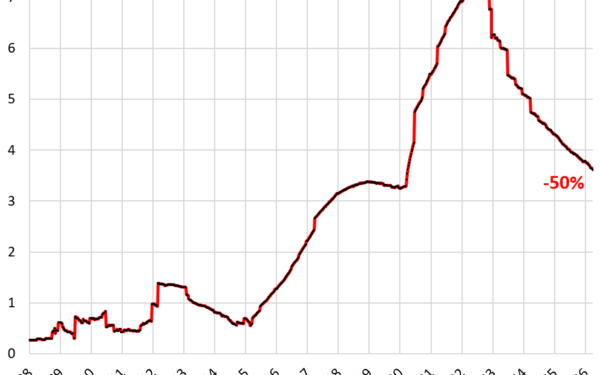
Durable goods prices exploded 1.0% month-to-month (+13.4% annualized), though year-over-year they were flat. Motor vehicles, the largest chunk, held steady. The culprits: gold-fueled jewelry (+7.0% monthly, +125% annualized, +10.8% y/y as retail caught up to spot gold’s 20% January rally). Sporting equipment, supplies, guns, and ammo also jumped—likely tied to geopolitical jitters and U.S. election-year demand. Computer software landed in durables somehow, adding to the mess.
These aren’t one-offs. Gold’s surge reflects safe-haven buying amid Middle East tensions and central bank hoarding (Russia, China added 1,000+ tons since 2022). Guns and ammo spikes echo 2020-2022 patterns during uncertainty. Context: PCE differs from CPI by weighting goods lower and imputing more services. But market-based PCE reveals goods inflation bleeding into core metrics faster than expected.
Fed’s Wake-Up Call
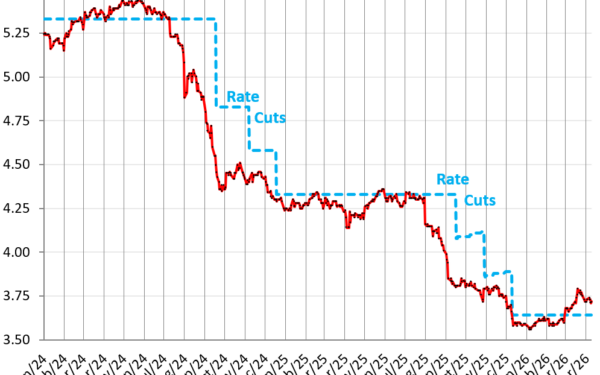
The Fed fixates on core PCE at 2%, yet six-month trends hit 3.4%, y/y at 3.0% (down slightly from 3.1%). Markets price in three 2025 rate cuts, but this data—pre-Iran war—flashes warning lights. Energy prices have since spiked 5-10% on conflict risks; add that atop February’s momentum, and annualized PCE could breach 3.5% soon.
Implications cut deep. Persistent 3%+ core erodes purchasing power, especially for fixed-income households. Bond yields ticked up post-release (10-year Treasury hit 4.3%), signaling trader doubt on cuts. The Fed paused hikes in 2023 after similar trends, but today’s “soft landing” narrative assumes housing weakness persists. If market-based pressures broaden—services ex-housing already firm at +4% annualized—the bar for cuts rises.
Bottom line: Policymakers track PCE over CPI for its broader basket and revisions. This report demands attention. Trends point up, not to target. Investors chasing yield in crypto or equities face volatility if rates stay higher longer. Track March data; war effects will amplify or expose the underlying heat.