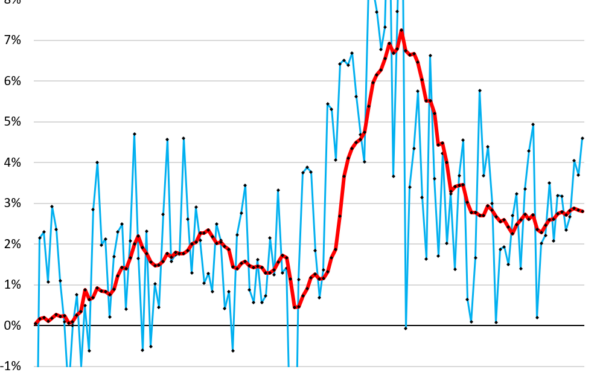
European housing markets diverge sharply. In Q4 2023—based on Eurostat data through the period—Hungary’s existing home prices surged 23.7% year-over-year, Portugal’s jumped 20.9%, and Bulgaria’s rose 15%. Meanwhile, Finland’s prices dropped 16.6% from their 2022 peak, reverting to 2010 levels. Germany sits 9.8% below its 2022 high. This split across 19 top EU/EEA economies by GDP signals uneven recovery from post-COVID booms and rate hikes. Why it matters: Housing drives 70-80% of household wealth here. Bubbles inflate inequality; corrections hit banks and spending.
Markets Stuck Below Peaks
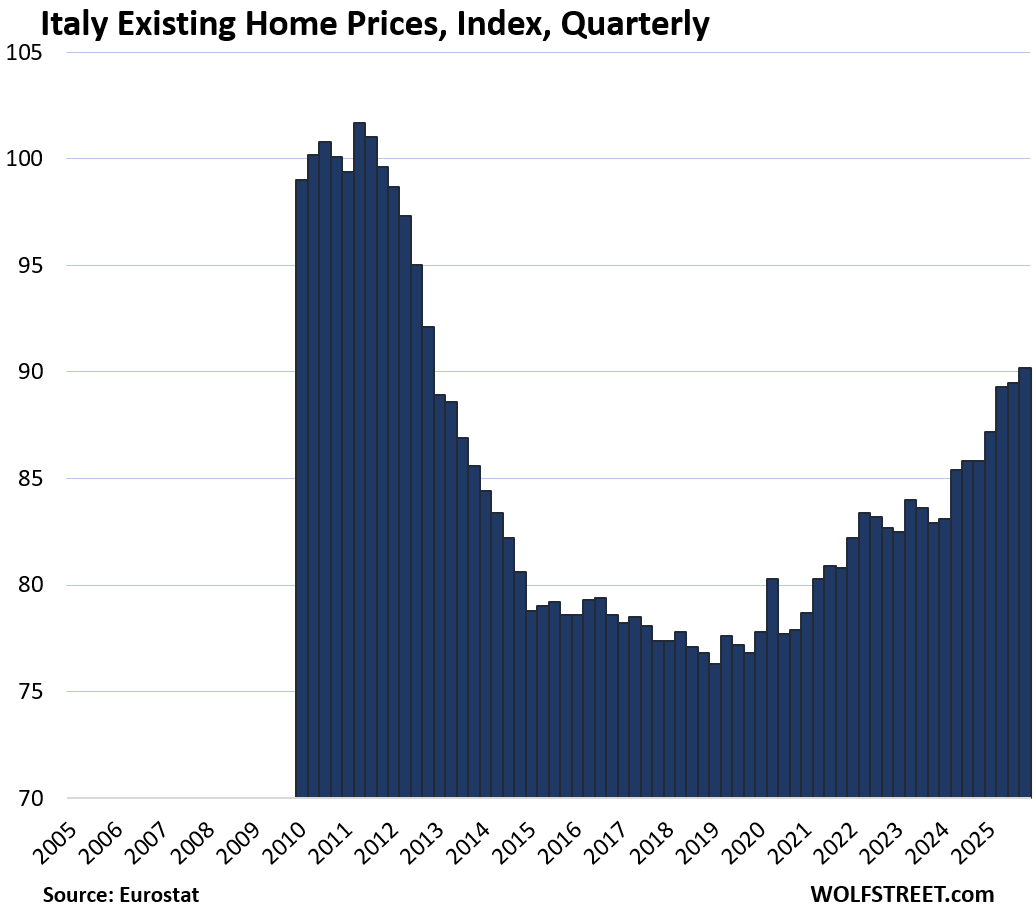
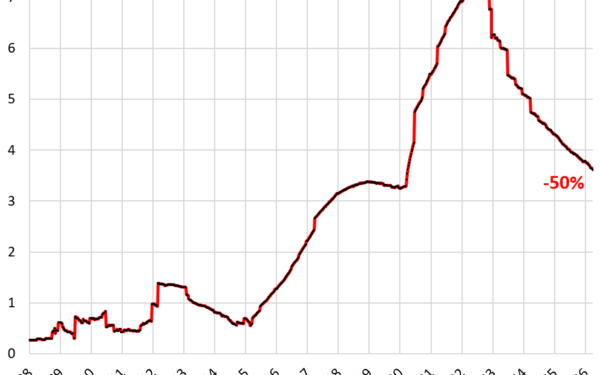
Six countries lag prior highs. Finland leads the fall: down 1.2% quarter-over-quarter (QoQ) in Q4, now matching 2010 after a brutal 2022 peak. Weak exports and high rates crushed demand. Italy remains 11.3% under its 2011 bubble top—despite 5.1% YoY gains lately—tied to chronic stagnation and youth exodus.
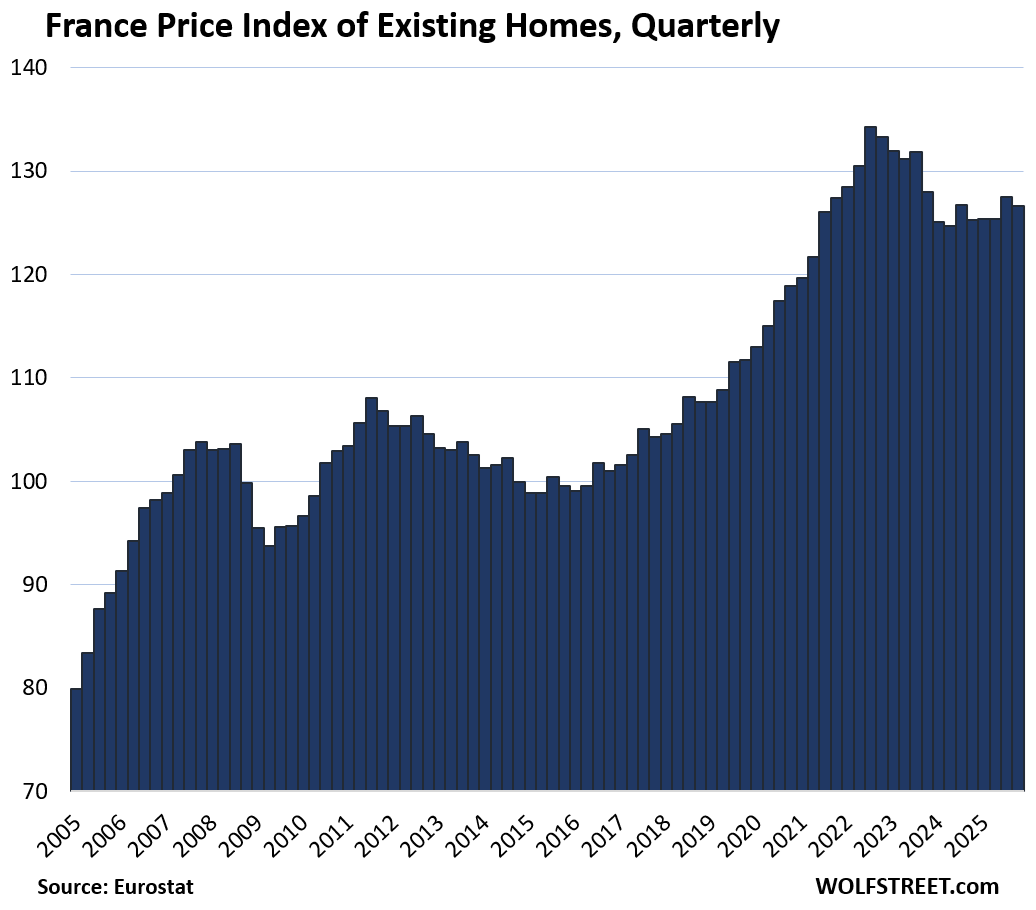
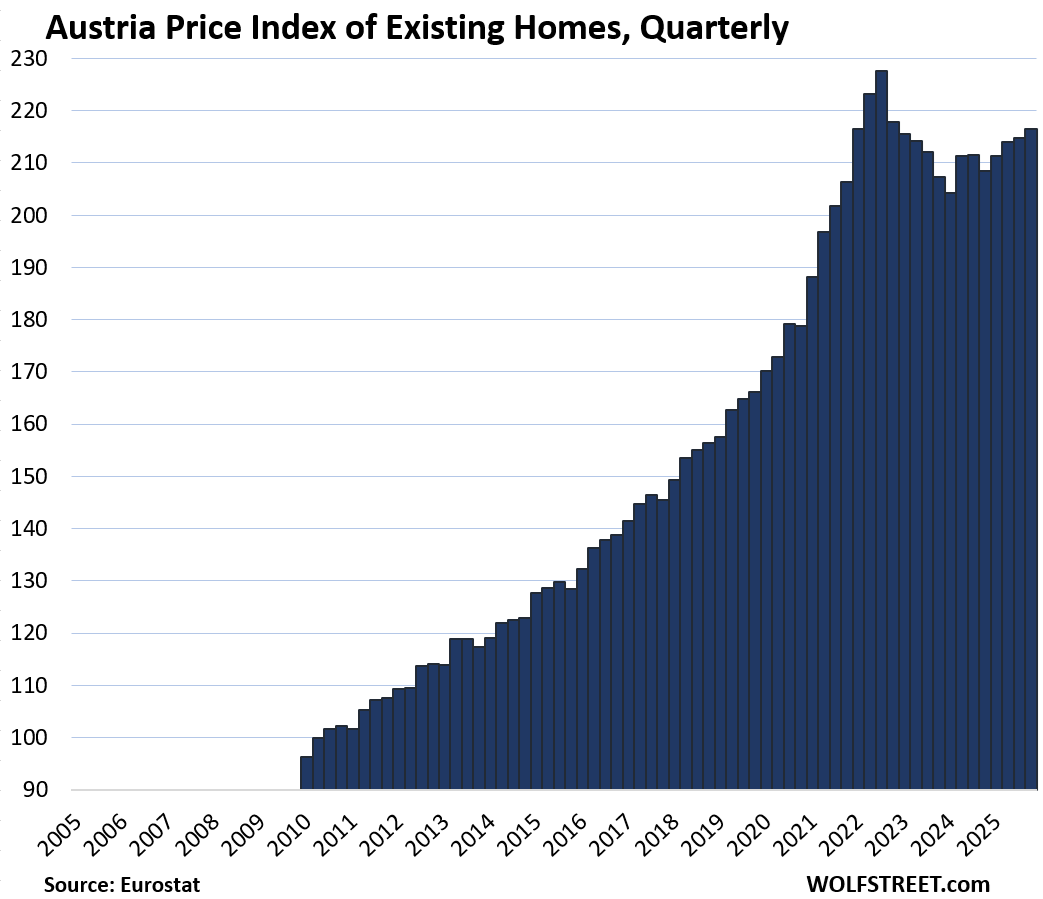
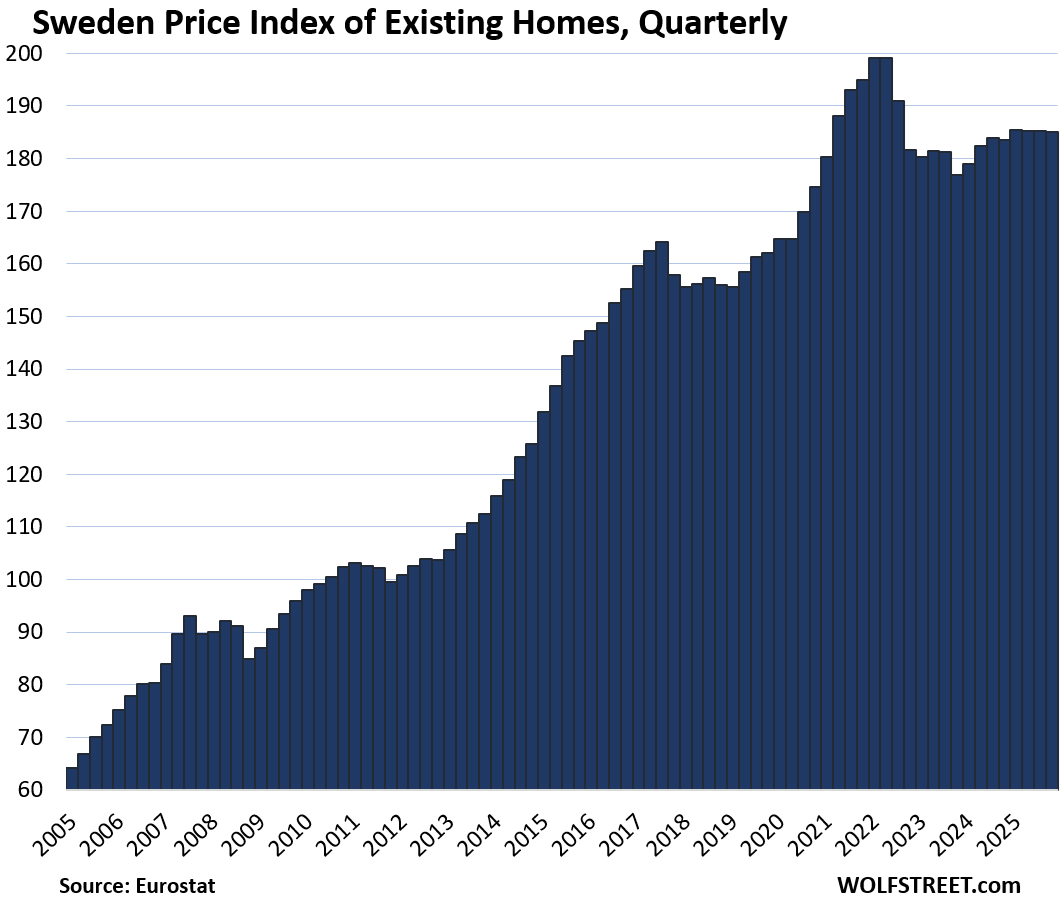
Germany (-9.8% from Q2 2022), France (-5.7% from Q3 2022), Austria (-4.8% from Q3 2022), and Sweden (-7.1% from Q2 2022) all declined QoQ: -0.2%, -0.7%, unchanged, and -0.1% respectively. Germany’s woes stem from soaring construction costs (up 20% since 2021) and ECB rates at 4%. Buyers face 5-6% mortgage yields, pricing out first-timers. Implication: No wealth effect boost for consumption; recession risks rise if prices slide further.
Top Gainers Fuel Bubble Fears
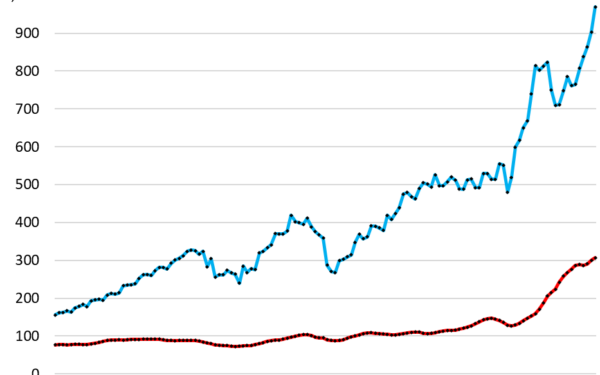
Hungary dominates short-term: 23.7% YoY, 4.8% QoQ, and 308% since 2010. Low base effects from post-2008 crash, plus Orbán’s subsidies, drive this. Portugal (175% since 2010, 20.9% YoY, 4.6% QoQ) benefits from golden visas and remote workers, but locals gripe at 10x income multiples in Lisbon.
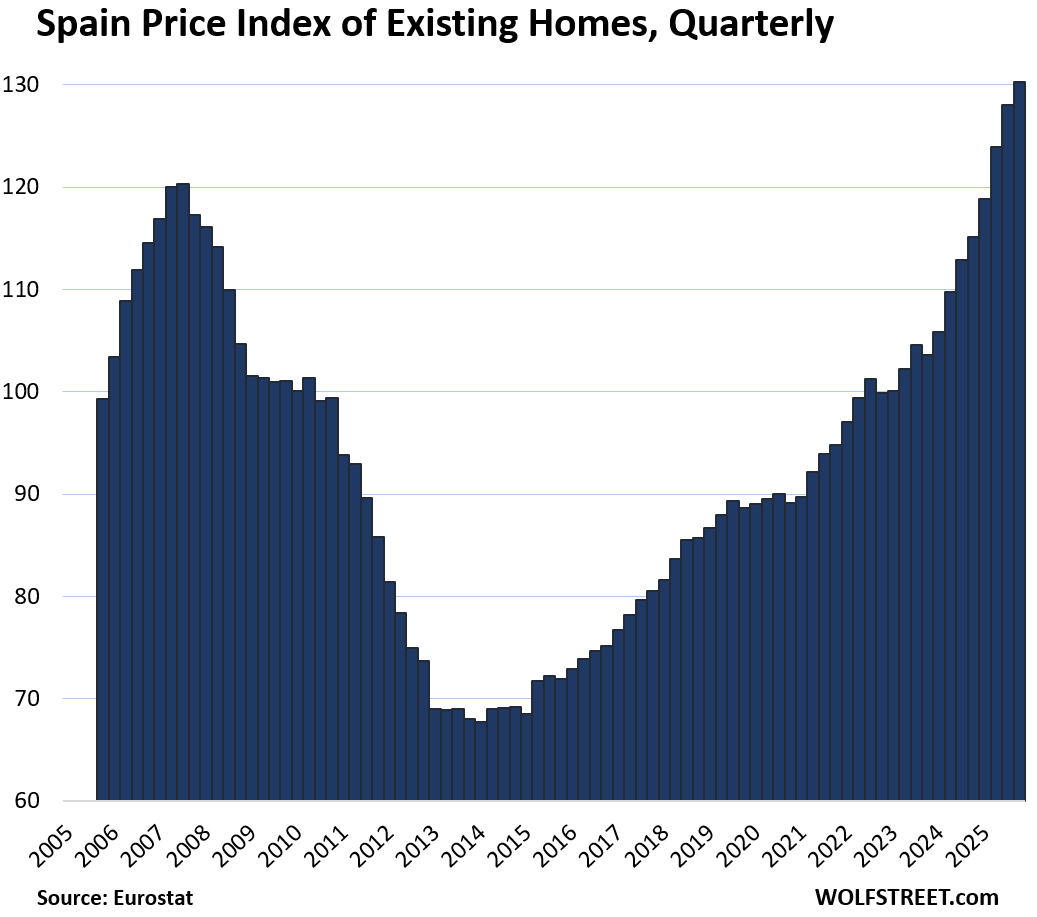
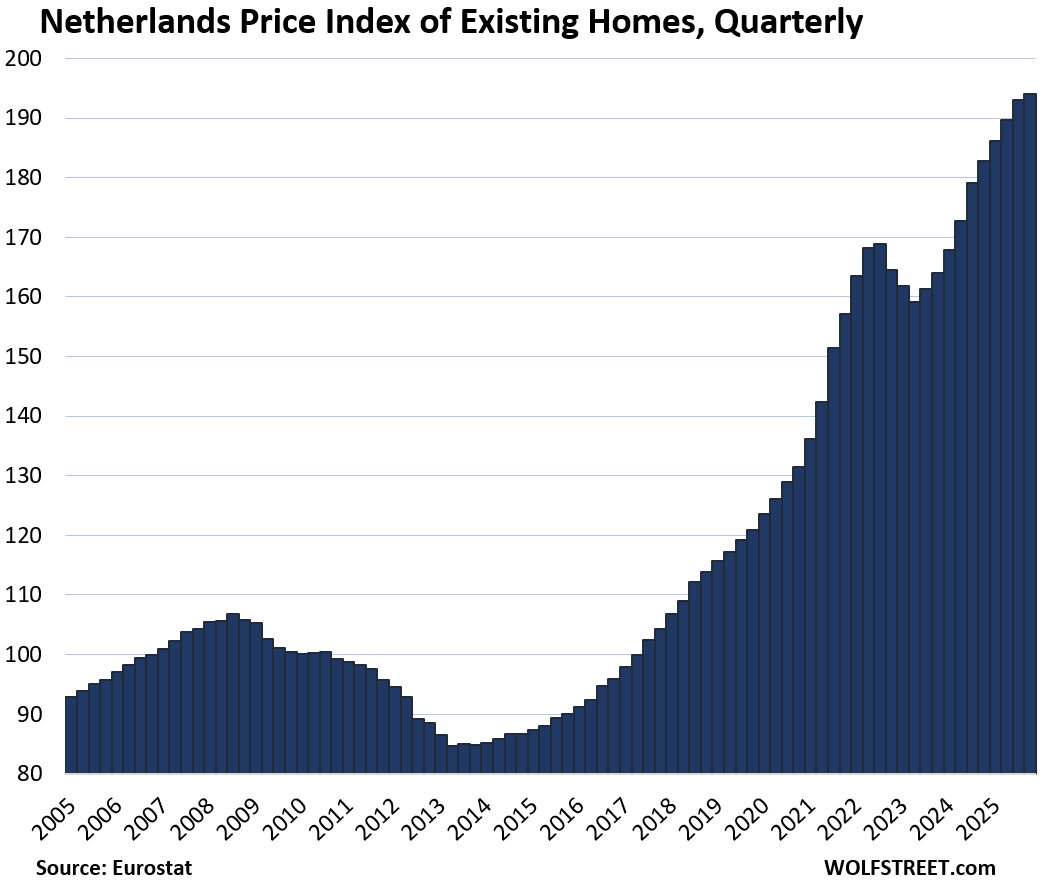
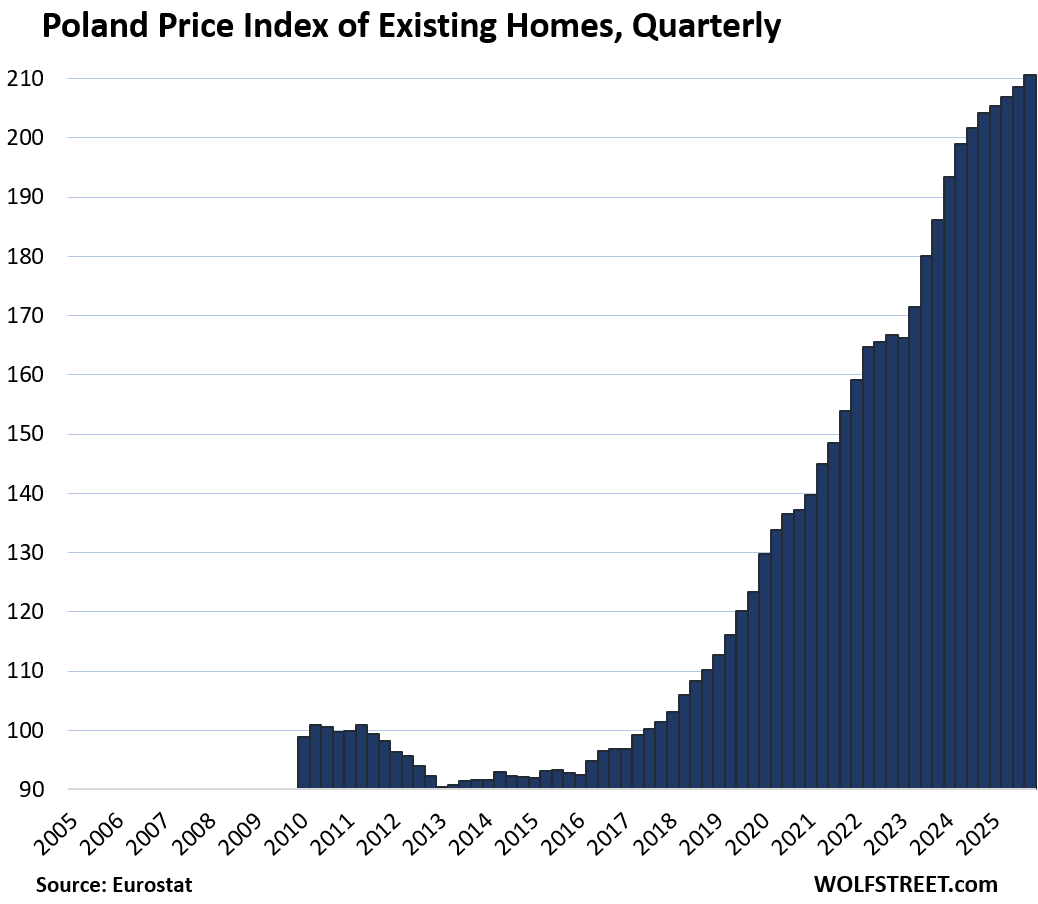
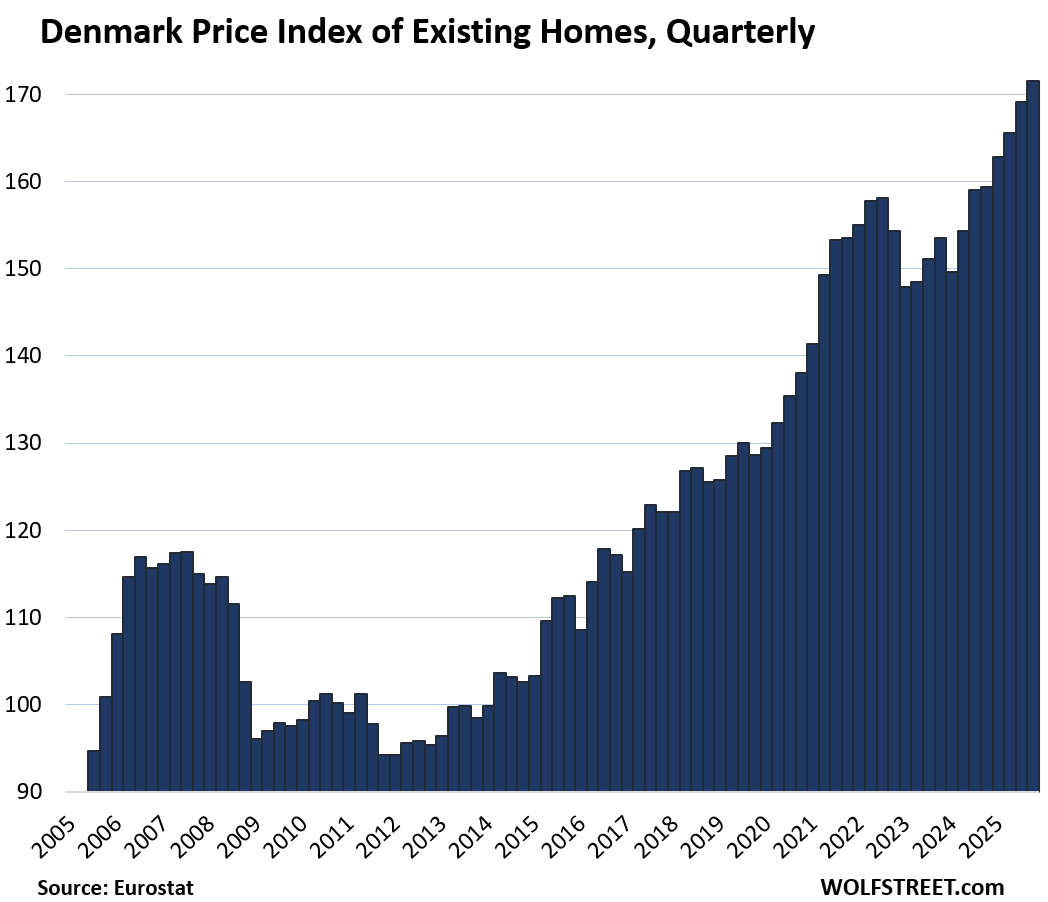
Bulgaria (147% since 2010, 15% YoY), Slovakia (13.4% YoY, 3.3% QoQ), Spain (13.2% YoY), Czech Republic (10% YoY, 2.4% QoQ), Denmark (7.6% YoY), Ireland (7.3% YoY), Romania (7.1% YoY), and Netherlands (6.2% YoY) round out risers. Since 2010 leaders: Hungary 308%, Portugal 175%, Czech 165%, Bulgaria 147%, Slovakia 138%. Supply shortages—EU built 20% fewer homes than needed in 2022—plus wage growth in Poland (+113%) and Norway (+111%) sustain momentum.
QoQ decliners beyond the peak laggards: Norway -0.9%. Broader trend: 14 of 19 posted YoY gains, but five QoQ dips signal rate-hike pain peaking.
Long-Term View and Risks
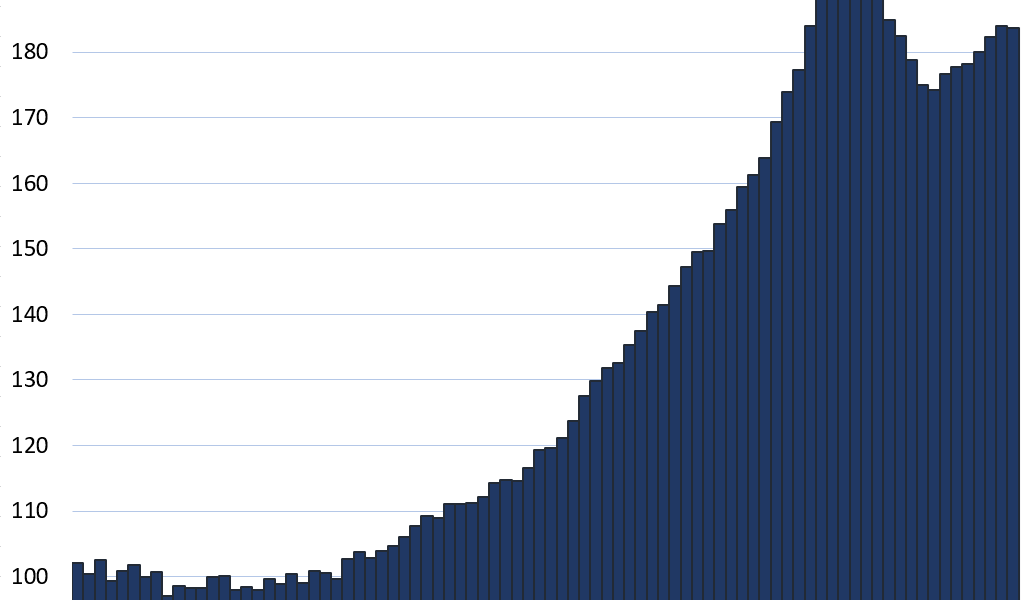
Index all base at 2010=100 for comparison (nominal prices; inflation-adjusted would cut gains 40-60%). Netherlands hit 194, but cooled. Germany at 185, down from 217 peak. Finland back to 100. No Greece data—its market likely fits the laggards post-debt crisis.
| Country | Since 2010 | QoQ Q4 | YoY Q4 | From Peak |
|---|---|---|---|---|
| Hungary | 308% | +4.8% | +23.7% | – |
| Portugal | 175% | +4.6% | +20.9% | – |
| Bulgaria | 147% | – | +15.0% | – |
| Germany | 85% | -0.2% | +3.0% | -9.8% |
| Finland | – | -1.2% | – | -16.6% |
Skeptical take: Headline surges mask affordability craters. EU average price-to-income hit 9x in 2023, vs. 5x sustainable. ECB cuts eyed for 2024 could reignite, but fiscal strains (Italy’s 140% debt/GDP) limit bailouts. Investors: Eastern edges like Hungary offer yield but currency risk (forint down 40% vs. euro since 2010). Buyers: Northern markets like Finland offer entry, but job security lags. Why this matters—housing locks 30% of EU GDP via construction, mortgages. Divergence fractures union: Hot spots draw capital, cold ones stagnate. Watch Q1 2024 for rate pivot clues.