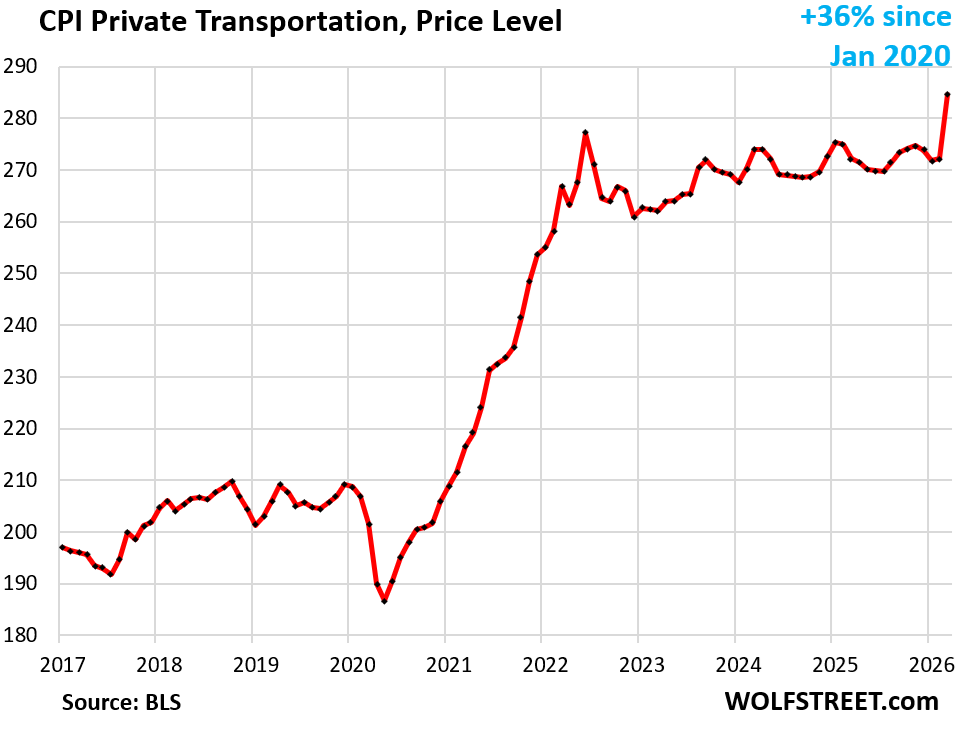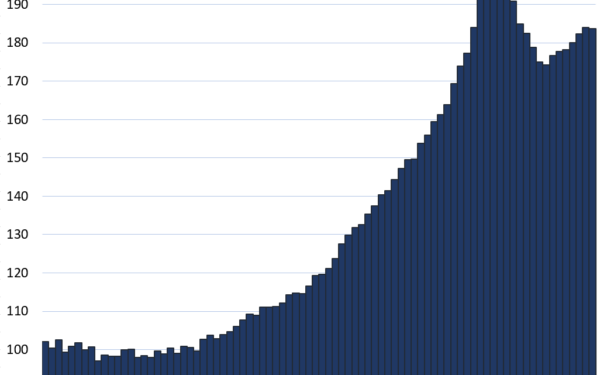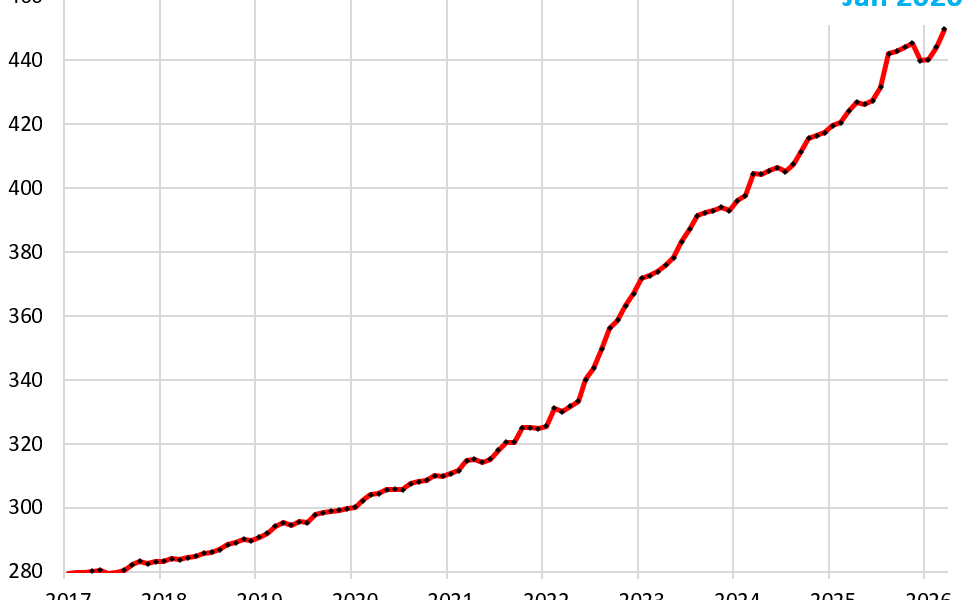
Americans face a 36% jump in total motor vehicle ownership costs since January 2020. This aggregate tracks new and used vehicles, gasoline, insurance, maintenance, repairs, parts, and fees. These expenses claim nearly 15% of the Consumer Price Index (CPI), hitting household budgets hard in a car-dependent nation where the average family owns two vehicles and drives 13,500 miles per person annually.
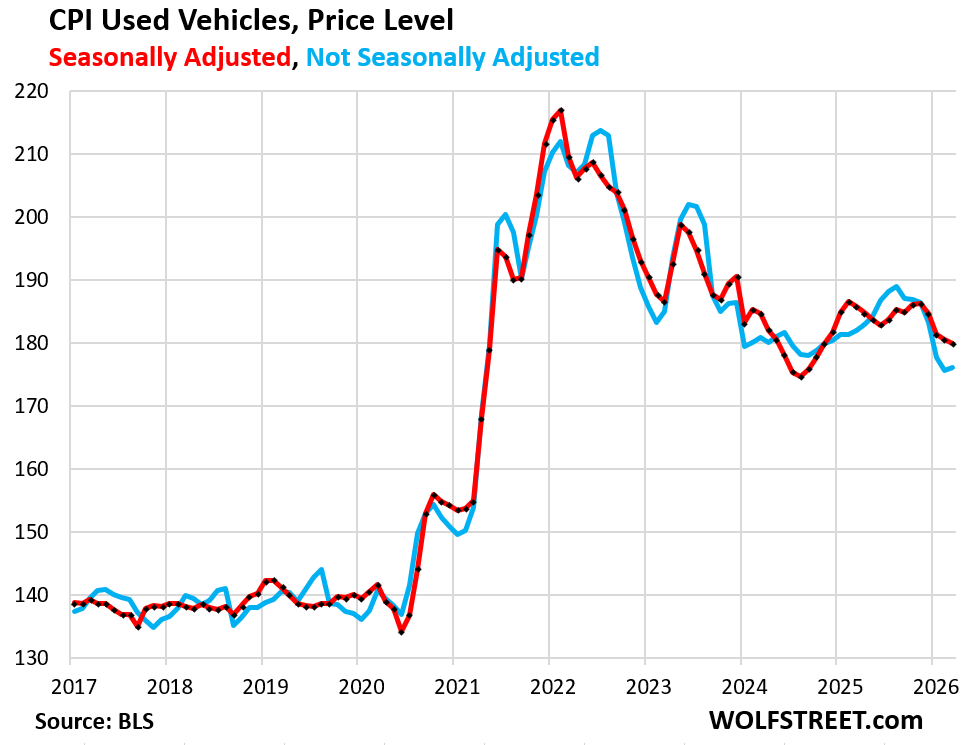
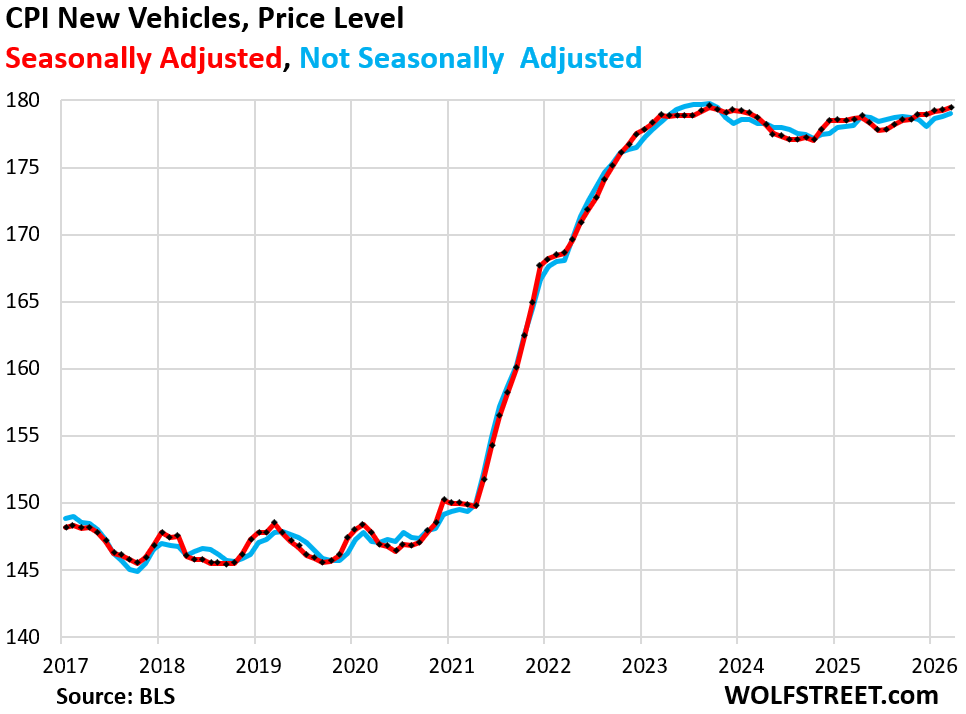
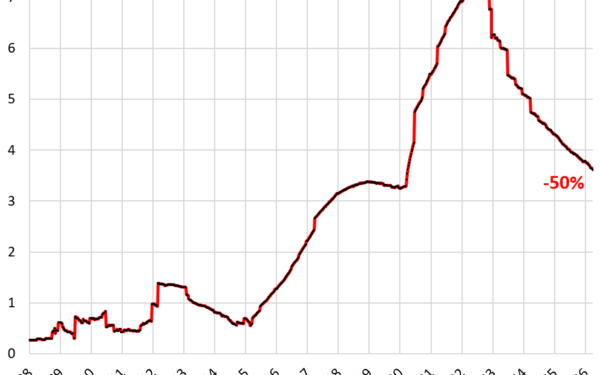
The Bureau of Labor Statistics (BLS) data reveals uneven spikes. New vehicle prices surged 41% from mid-2020 to early 2022 due to chip shortages and supply chain snarls post-COVID. They peaked, then fell 10% from that high but remain 30% above 2020 levels. Used vehicles fared worse: up 54% in the same period, driven by low inventory as owners held onto cars amid new-vehicle scarcity. Prices corrected sharply afterward—down 20% from peak—but still sit 25% higher than pre-pandemic.
Maintenance and Insurance Lead Ongoing Pain
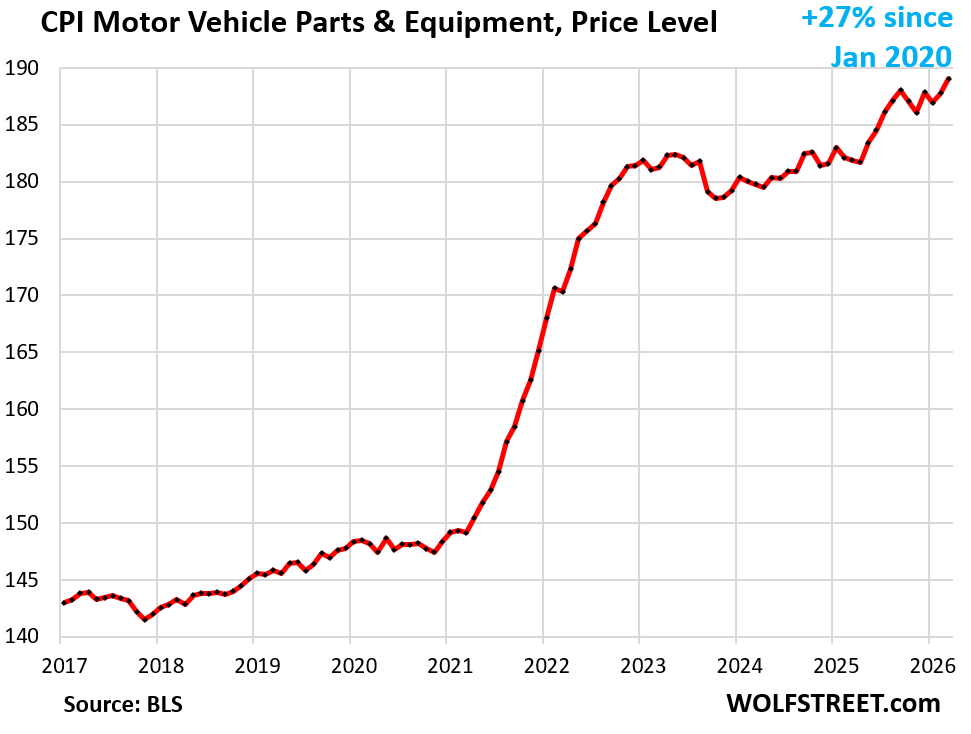
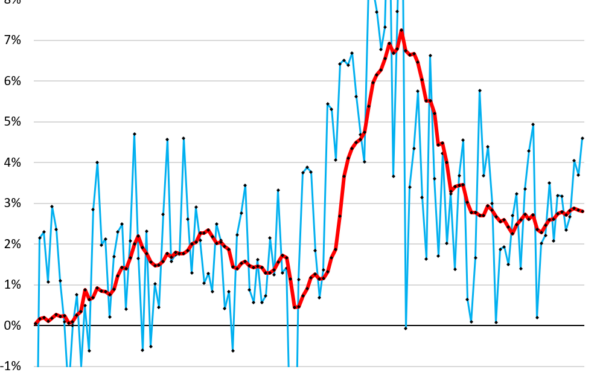
Vehicle maintenance and repair costs exploded 50% since 2020. Labor shortages and surging mechanic wages fueled this; BLS reports a 1.25% monthly rise in March alone, with 6.1% year-over-year inflation. Shops charge premium rates for diagnostics and work on complex modern cars, where a single repair can exceed $5,000. Parts and equipment rose 27% overall, though milder at 0.7% monthly and 3.9% yearly now. Supply delays from Asia pushed tire and component prices up 15-20% in 2021-2022.
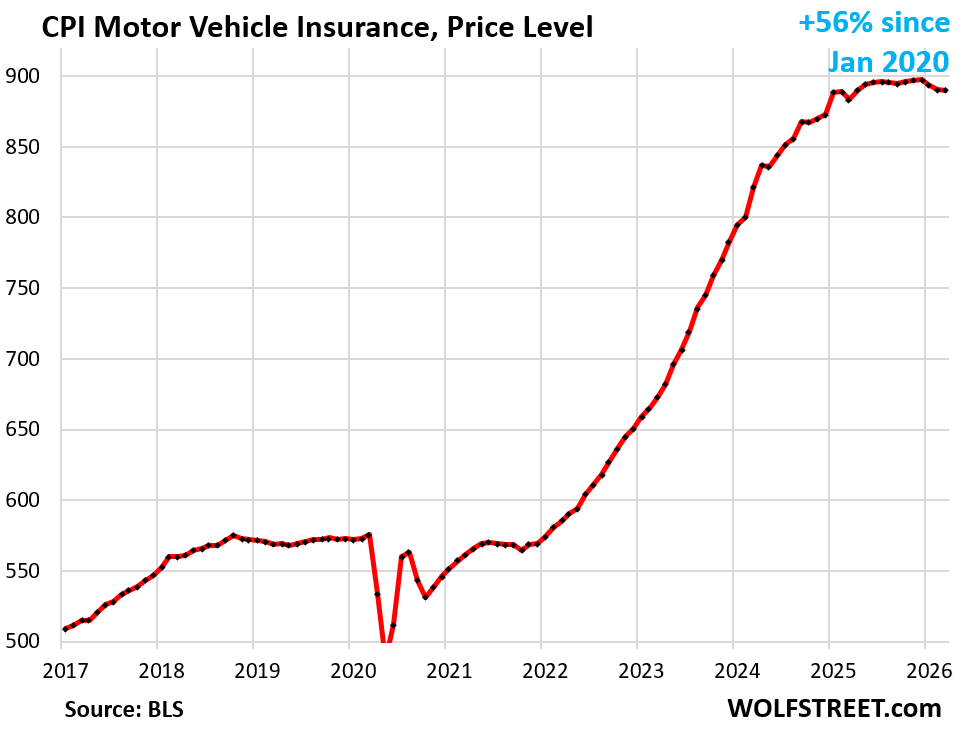
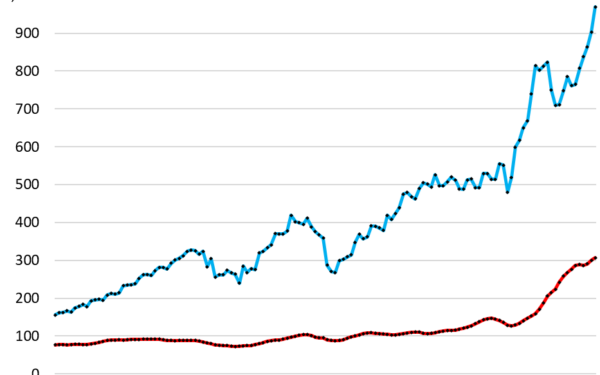
Auto insurance premiums ballooned 56% since 2020, reflecting insurers’ scramble to cover skyrocketing repair bills and used-car replacement values. Rates peaked in mid-2024, up 20% year-over-year then, but flattened recently—unchanged in March. Full coverage now averages $2,500 annually nationwide, per recent Quadrant data, squeezing drivers who can’t drop coverage. Insurers profited handsomely post-hikes, with combined ratios improving, yet they cite theft rates and climate-driven claims as justification.
Fuel and Fees Add Volatility
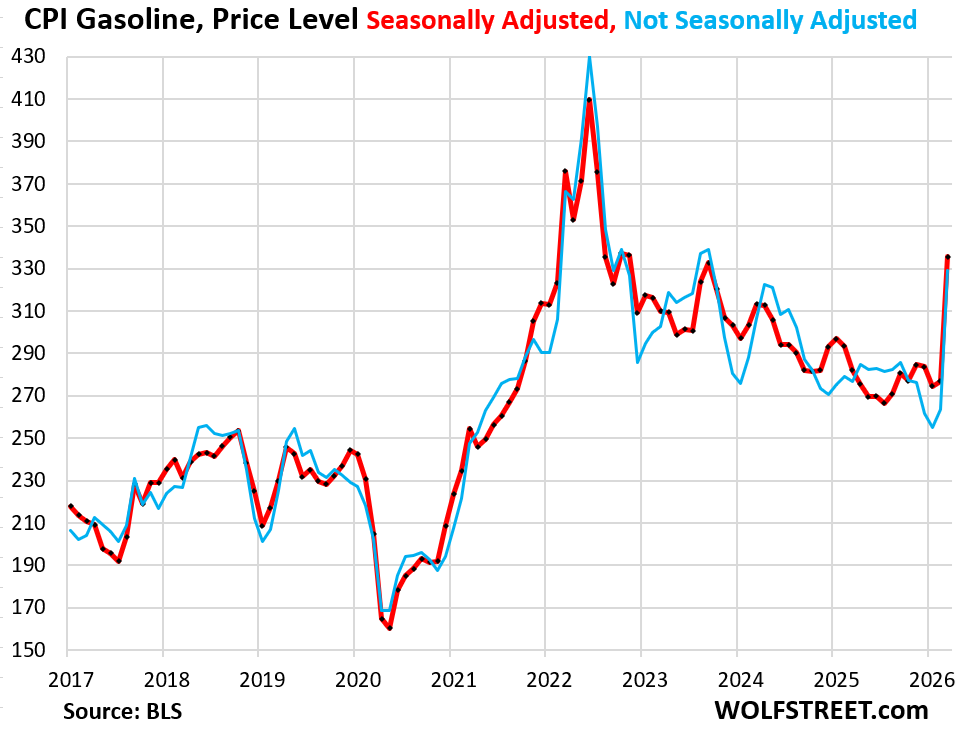
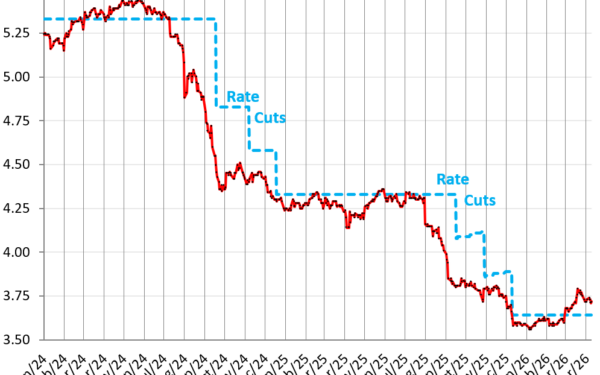
Gasoline prices spiked 80% from late 2020 to mid-2022 amid post-pandemic demand rebound and the Ukraine war’s oil shock. They plunged 30% after, but recent Middle East tensions triggered a re-spike—regular unleaded hit $3.60/gallon nationally in April 2025. Annual fuel costs for average drivers exceed $2,000, per AAA, amplifying pain for the 70% without EV access.
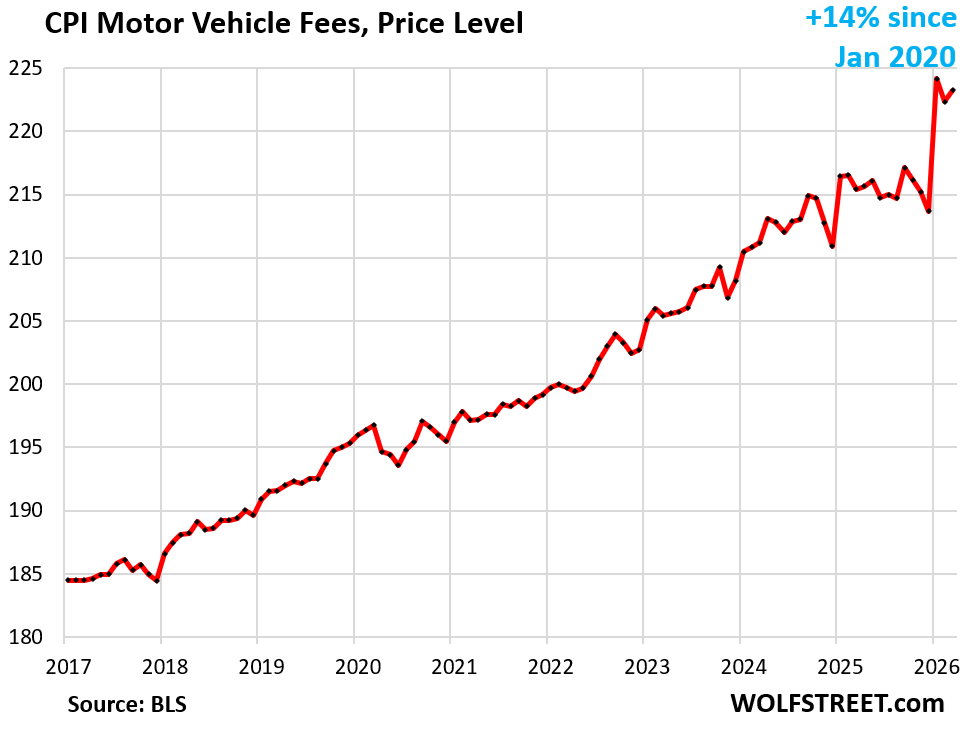
Motor vehicle fees—registrations, licenses, tolls—rose a comparatively tame 14% since 2020, but accelerated with a 3.6% yearly gain and 0.42% monthly in March. States hiked them for budget shortfalls; California added $100+ per vehicle in emissions fees alone. These fixed costs hit low-mileage owners hardest.
This 36% aggregate masks real household impacts. Average annual ownership cost per new vehicle reached $12,182 in 2024 (AAA estimate), up from $9,000 pre-2020—adding $3,000+ yearly. Lower-income families, who spend 20% of income on transport, delay repairs or upgrades, risking safety and reliability. Used-car market stabilization helps, with inventory at 2.5 million (vs. 2 million trough), but affordability lags; sub-$20,000 options vanished.
Skeptically, not all stems from “inflation.” Pandemic distortions, just-in-time manufacturing failures, and profiteering inflated prices—dealers pocketed $2,000+ extra per new car at peak, per FTC. Government policies, like EV mandates without grid upgrades, deter transitions; only 10% of sales are electric amid high upfront costs ($10,000 premium over gas cars).
Why this matters: Eroding mobility in suburbs and rural areas where public transit covers 5% of trips. Savings rates, already at 3.2%, suffer as households allocate 17% of spending to vehicles. Crypto holders or not, this forces trade-offs—skip vacations, eat out less, or finance at 7%+ rates. Watch for relief if rates fall and supply normalizes, but labor and insurance stickiness suggests costs stay elevated. Track BLS monthly for signals; March’s mixed bag shows cooling in some spots, heat in others.