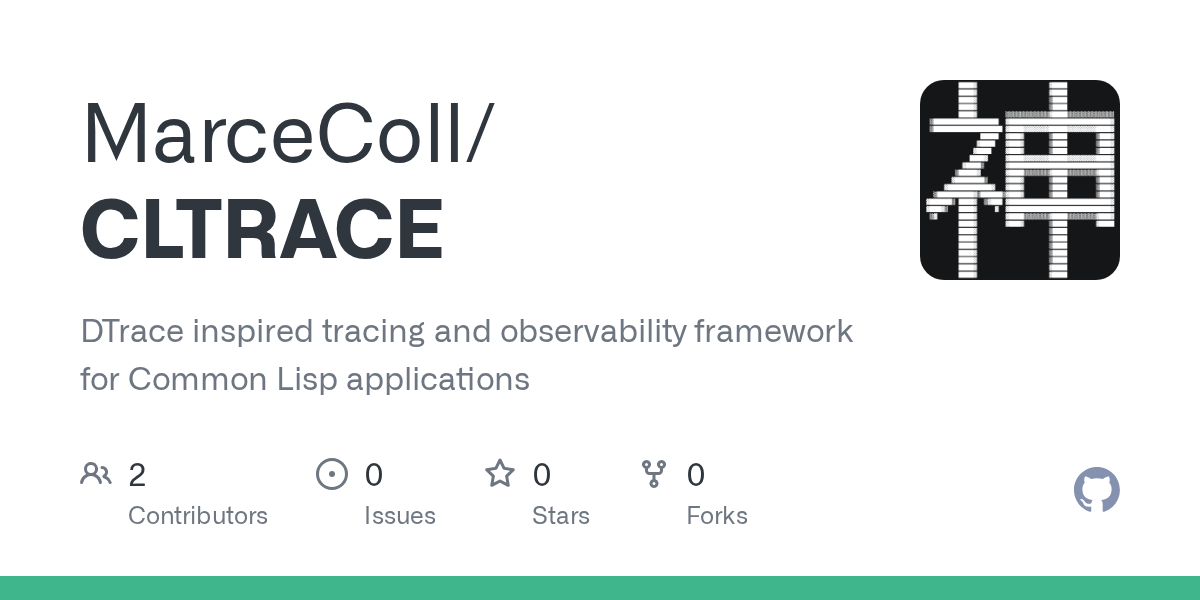
CLTRACE delivers DTrace-style tracing to Common Lisp applications, enabling developers to probe live production systems without restarts or high overhead. This alpha-stage tool registers dynamic probes on function entries and exits, applies predicates, aggregates data, and supports interactive scripting. For Lisp users running long-lived servers—think finance trading engines or AI inference services—it closes a critical observability gap where traditional debuggers fall short.
Common Lisp powers reliability-focused niches: Ravenpack’s financial analytics, Franz’s AllegroServe web servers, and even parts of Grammarly’s backend. These systems demand zero-downtime debugging. Lisp’s dynamic nature allows runtime modifications, but lacks Unix DTrace’s power for kernel-to-user tracing. DTrace, introduced in Solaris 10 (2005), probes arbitrary code points with predicates like @count = count() for aggregations. CLTRACE mimics this in userland Lisp, using macros to insert probes at function boundaries.
Core Mechanics
You define “programs” via cltrace:define-program, which compile into probe actions. Here’s the provided example, reformatted:
(cltrace:define-program some-name
  ((:entry cltrace:some-test
           :when (= a 3))
   (agg! counts fn-name :count)
   (setvar :value t)))
This probe fires on entry to cltrace:some-test only when argument a equals 3. It increments a counter in the counts aggregation table keyed by function name, then sets a program-wide variable. Aggregations persist across probes, enabling cheap metrics like call counts over the program’s lifetime. You deploy these statically or build them interactively in a REPL, querying results with functions like getagg or getvar.
Probes minimize interference: they use Lisp’s condition system for low-cost checks and avoid full stack unwinds unless needed. This contrasts with SLIME’s Swank debugger, which pauses threads, or SBCL’s statistical profiler, which samples but lacks predicates. CLTRACE’s programmability lets you script complex logic, like tracing slow paths only under load.
Risks and Limitations
Labelled alpha, CLTRACE warns of instability—expect crashes or incomplete traces in multithreaded SBCL or CCL environments. No benchmarks exist, but probe overhead could spike under high call volumes; DTrace sustains millions of probes per second on modern hardware via kernel optimizations, while Lisp userland might lag. The repo lacks tests, docs beyond examples, and integration with tools like Prometheus.
Security implications matter in production: probes run arbitrary Lisp code, risking escapes if misconfigured. Deployers must sandbox them, perhaps via separate images or ASDF systems. The author confirms no LLM-generated code, but used them for ideas—common practice, yet it underscores solo development’s limits.
Why It Matters for Lisp Ecosystems
Lisp trails languages like Go (with pprof) or Java (Micrometer) in observability. Tools like Caveman or Hunchentoot offer basic logging, but not dynamic tracing. CLTRACE pushes Lisp toward eBPF-like capabilities, where observability compiles to efficient bytecode. If it matures, expect forks for Quicklisp integration or Web UI dashboards.
For finance/crypto firms using Lisp (e.g., some HFT desks on Allegro), this means dissecting live anomalies—like erratic order matching—without downtime. Broader trend: programmable observability scales with complexity; static logs drown in petabytes. Skeptically, it needs battle-testing, but at zero cost, Lisp tinkerers should prototype now. Track the GitHub repo for updates; production use demands forks with metrics.
In sum, CLTRACE isn’t revolutionary—DTrace did it 20 years ago—but it’s a pragmatic step for Lisp’s underserved runtime. Developers gain power to observe what matters: rare events, aggregations, live tweaks. Weigh the alpha risks against stalled debugging cycles.