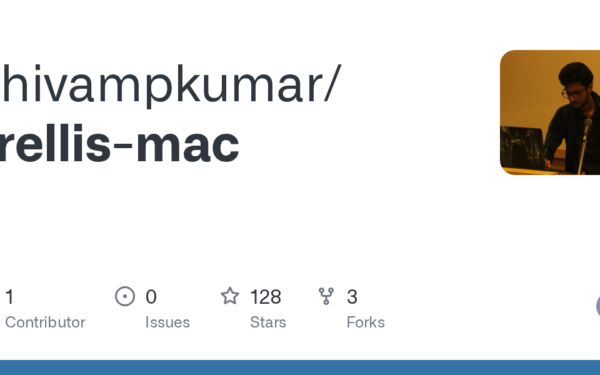
Developers can now time travel debug WebAssembly programs directly in VS Code. The open-source gabagool-debug-adapter implements a Debug Adapter Protocol (DAP) server that records Wasm execution traces and lets you step forward, backward, or jump to specific points. It targets .wat files today—Wasm’s human-readable text format—but aims to support DWARF debug symbols for original source stepping in the future.
This matters because WebAssembly debugging has long lagged behind JavaScript or native code. Wasm compiles high-level languages like Rust, C++, or Go into dense binaries that browsers and runtimes execute at near-native speeds. Without good tools, bugs hide in optimized stacks, making reproduction and root-cause analysis painful. Time travel debugging flips this: it captures every instruction, opcode, and stack state, letting you rewind to the exact moment a buffer overflow or memory leak started. In 2023, Wasm usage exploded—over 2% of top websites run it, per Go WebAssembly stats, and blockchains like Polkadot and Solana execute smart contracts in Wasm VMs. Better debugging accelerates adoption for performance-critical apps.
How It Works and Setup
The adapter hooks into VS Code’s DAP, the same protocol powering debuggers for Python, Node.js, and more. It instruments Wasm execution (likely via wasmtime or wasmedge runtimes under the hood) to log a full trace. You inspect locals, globals, memory, and tables at any point, just like in Replay.io for JS or rr for Linux binaries.
Start in one click: Open the GitHub repo in Codespaces. The container builds automatically—expect 2-5 minutes depending on your connection. Hit F5, select a .wat program from the dropdown, and debug. No local setup needed.
For local VS Code:
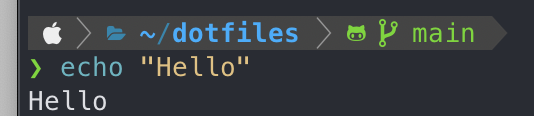
# Build and install the adapter
./gabagool-debug-adapter/local-install.sh

# Symlink the extension
ln -sfn "$(pwd)/gabagool-debug-adapter" ~/.vscode/extensions/gabagool-debug

# Reload VS Code (Cmd+Shift+P > "Developer: Reload Window")
Open any .wat file, press F5, pick your binary. It launches a debug session. Stepping feels native: F10 for next, Shift+F5 to stop, and reverse commands rewind the trace.
Limitations and Real-World Implications
It’s .wat-only for now. .wat is great for learning or small modules—think (module (func $main (i32.const 42) drop))—but real projects compile from LLVM IR via wasm-opt or rustc. DWARF support would parse symbols from those binaries, mapping back to C/Rust lines. That’s ambitious: DWARF in Wasm requires tools like wasm-objdump and custom unwinders, and traces balloon in size for large programs (gigabytes for seconds of execution). The repo notes this as a “lofty goal,” so expect delays.
Performance hits exist. Tracing every linear memory access or branch slows things 10-100x versus normal runs, fine for debugging but not production. Skeptically, the project is new—first commits in late 2023, under 100 stars. Test it yourself; edge cases like threads (Wasm’s threads proposal) or SIMD ops might break. No security audits yet, so if auditing crypto wallets or blockchain contracts, verify traces manually.
Why push this forward? Wasm powers edge computing (Cloudflare Workers handle 20% of web traffic in Wasm), serverless functions, and even desktop apps via Tauri. Time travel cuts debug cycles from hours to minutes—critical when a heisenbug vanishes on logs. For security researchers, it exposes memory corruptions invisible in black-box fuzzing. Pair it with wasmtime’s --debug or Binaryen passes for full workflows.
Grab it, trace a faulty module, and see if it sticks. In a Wasm world growing 50% yearly, tools like this separate hobbyists from production teams.