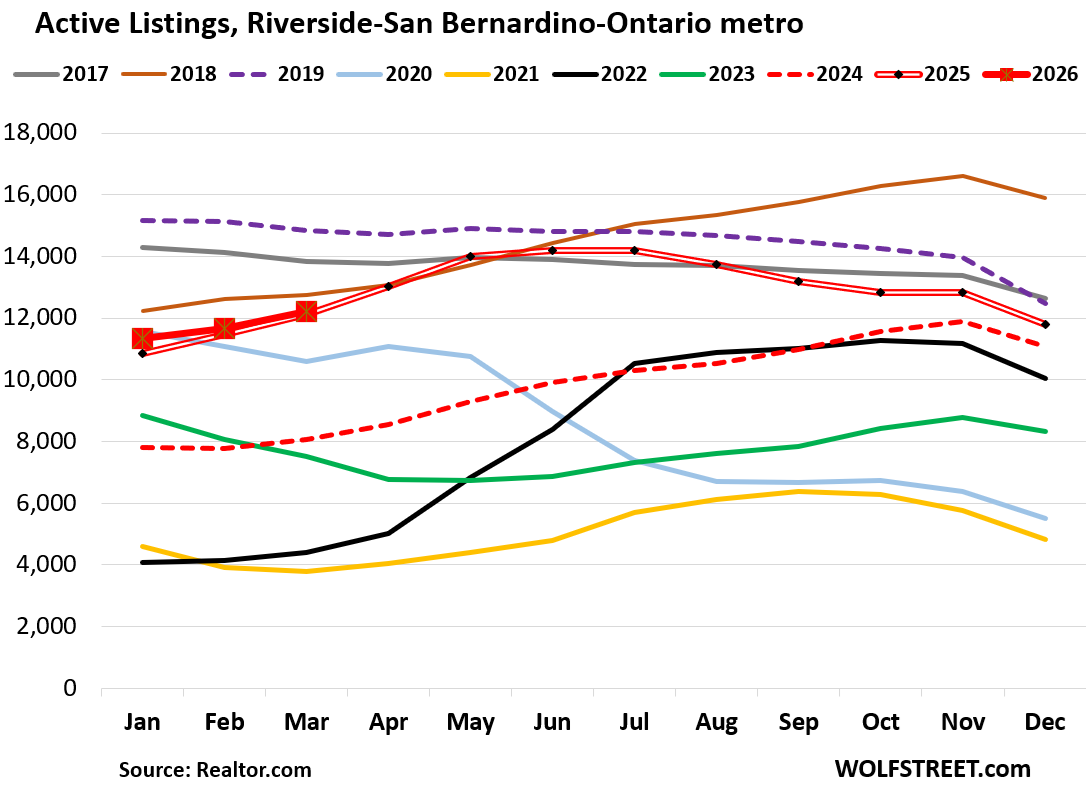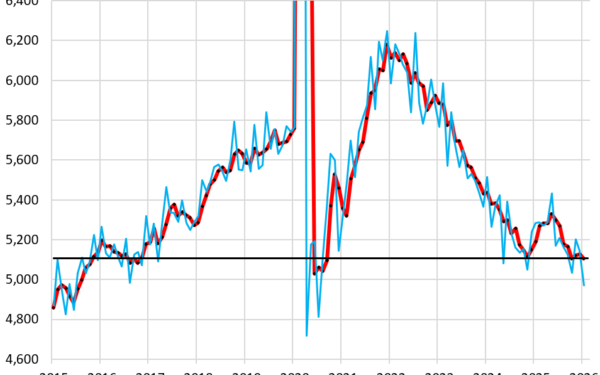
California’s active home listings climbed to 60,521 in March, the second-highest total for any March in the past decade. Only March 2019 beat it. This surge happened as buyer demand collapsed under 6.4% mortgage rates—the highest since the pandemic low-rate frenzy.
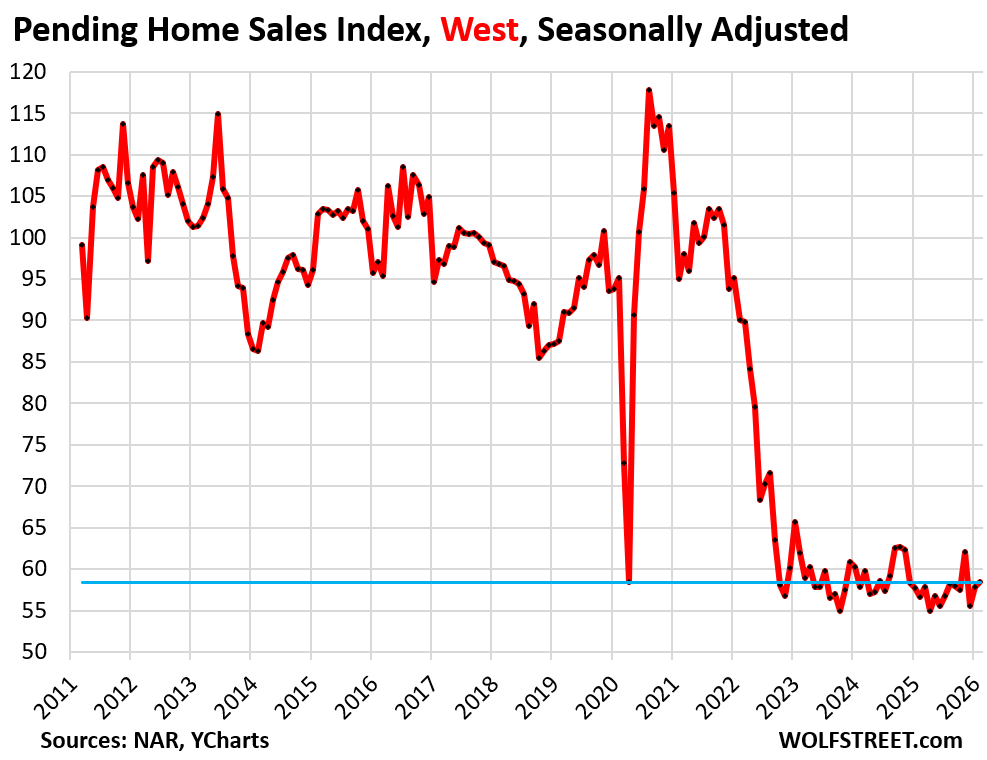
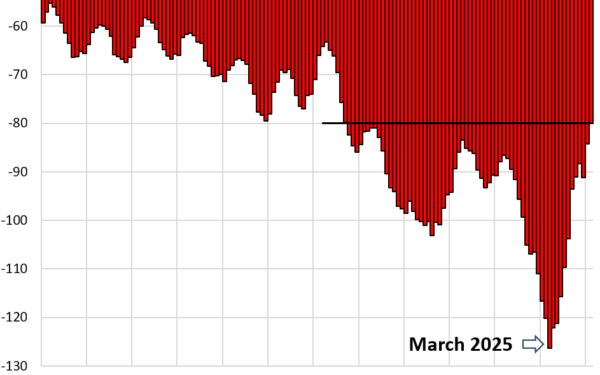
Realtor.com data, stretching back to mid-2016, shows listings up 5% from March 2023, 57% from March 2022, and 105% from March 2021. Pending sales in the West already lagged 33% behind 2019 levels by February. March crushed demand further: mortgage purchase applications plummeted.
Sellers aren’t flooding the market with new supply. Instead, weak demand—down 25-35% from pre-pandemic norms—leaves homes lingering. Prices ballooned during sub-3% rates, pricing out buyers. Delistings stay high, capping the inventory pile-up.
Silicon Valley Leads the Inventory Boom
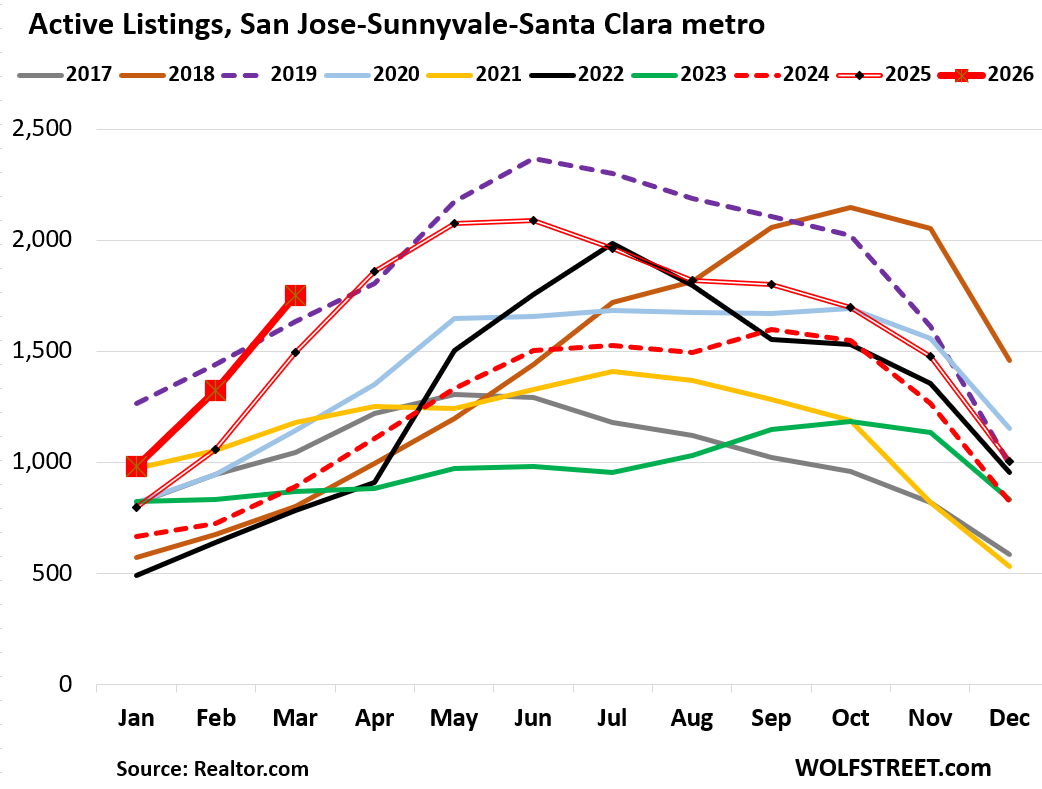
San Jose-Sunnyvale-Santa Clara metro (southern Silicon Valley) set a March record: 1,753 active listings. That’s 17% above March 2023 and 97% over March 2022. This area covers Santa Clara and San Benito counties, blending tech hubs with rural edges.
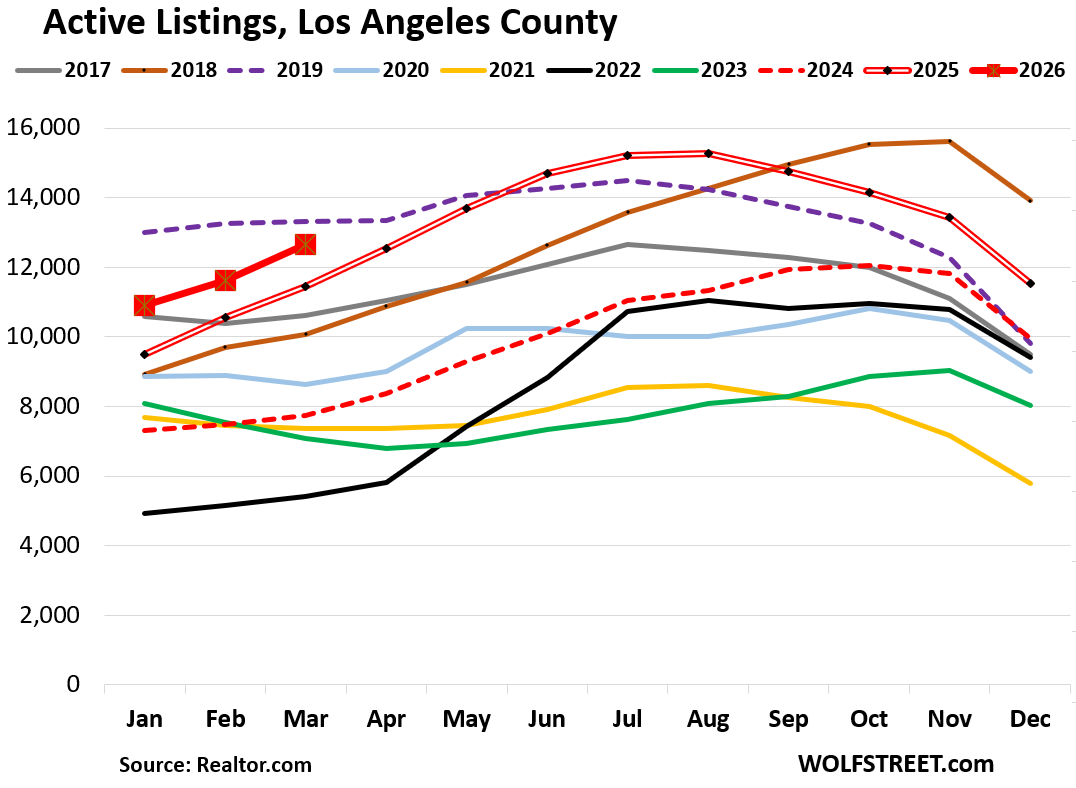
Los Angeles County followed with 12,647 listings—second-highest March in 10 years, trailing only 2019. Up 10% year-over-year and 63% from two years prior.
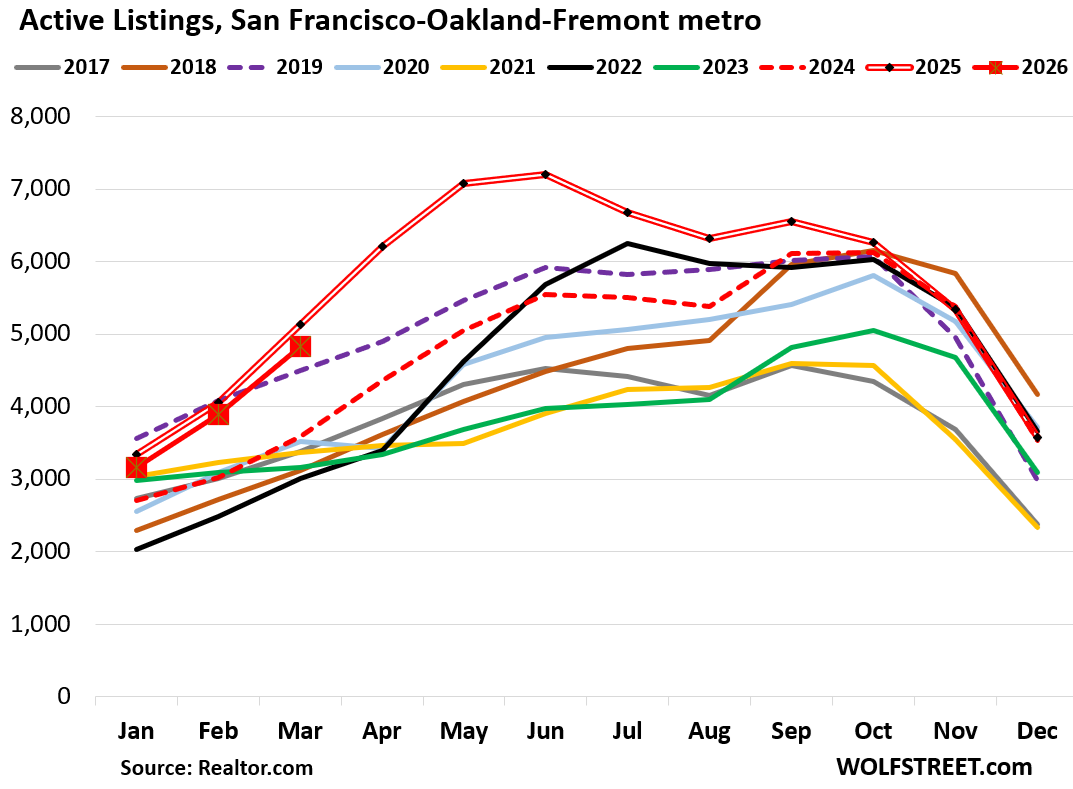
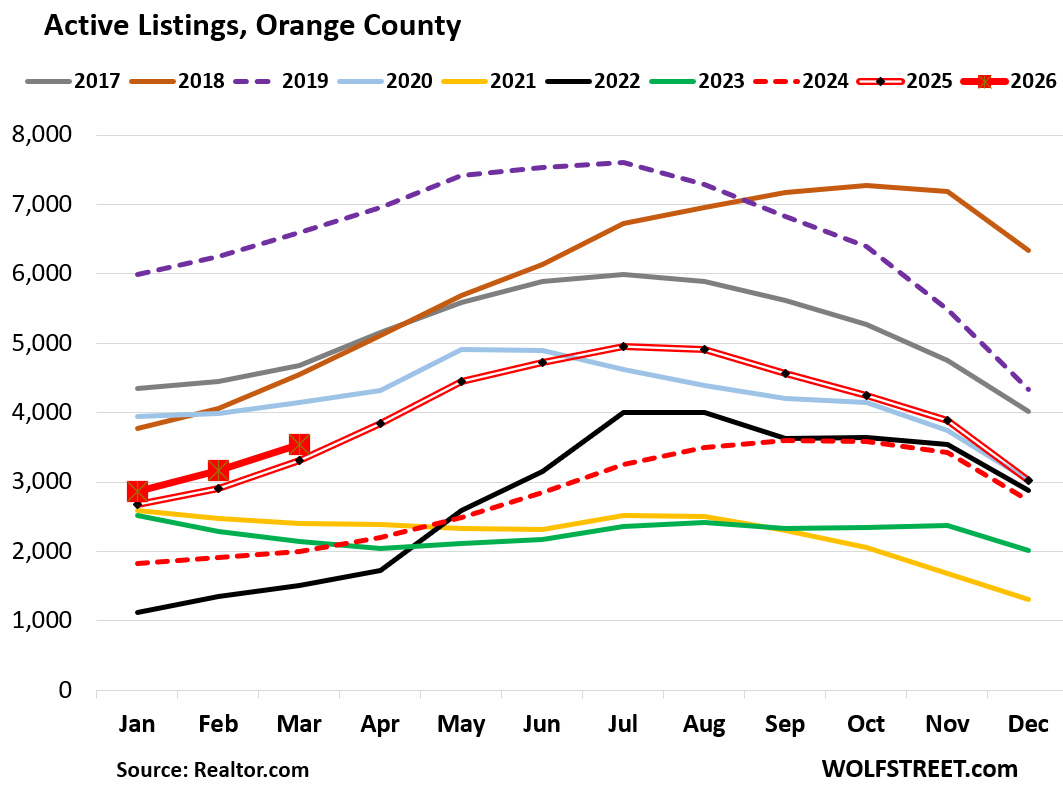
Contrast this with Orange County, which trails the pack. San Francisco-Oakland-Fremont metro bucked the trend entirely: listings dropped 6% from March 2023, though still elevated historically.
Historical Echoes and What Drives It
This mirrors 2018-2019. Back then, Fed rate hikes pushed 30-year mortgages to 5% by late 2018. Inventories swelled until the Fed pivoted, cutting rates in mid-2019 as inflation cooled. Sales rebounded; listings eased.
Today’s drivers differ slightly. Pandemic stimulus and remote work juiced prices 50-100% in hot spots like San Jose (median now ~$1.5M). Affordability craters: California’s housing cost burden hits 50% of income for median buyers at current rates.
Tech layoffs—over 100,000 in Bay Area since 2022—exacerbate the stall. High earners locked in sub-4% rates via “rate lock-in” stay put, unwilling to trade up at 6.4% costs.
Why This Matters: Cracks in the Fortress
Buyers gain leverage. More choices mean negotiation room, especially in San Jose where listings doubled year-over-two. Days-on-market stretch toward 40-50 days statewide, up from pandemic lows under 20.
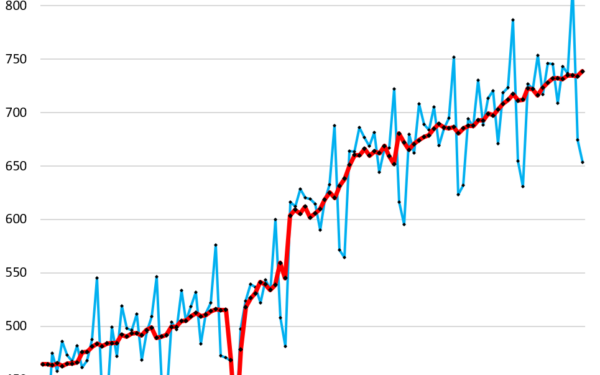
Prices resist drops so far—statewide median hovers at $800K, up 5% year-over-year. But momentum shifts. If rates hold or climb (Fed funds at 5.25-5.5%, inflation sticky at 3.5%), expect softening. Zillow forecasts 1-2% CA price dips by year-end.
Sellers face reality checks. Overpriced ego listings delist quietly. Investors eye opportunity but tread warily: cap rates compress under high financing costs, vacancy risks rise in cooling rentals.
For finance pros, this signals broader caution. California’s 15% of U.S. GDP ties housing to stocks, crypto correlations via tech wealth. Inventory spikes precede corrections—recall 2006-2008, when listings tripled before the crash.
Bottom line: Demand’s wilt tests the post-pandemic price mirage. Buyers wait for rate relief; sellers test patience. Markets like San Jose tip first toward balance. Watch April data—spring buying season decides if this is thaw or freeze.